
In this post you will only find active and Next Gen stats, if you are looking for all-time stats check out my previous article All-Time Cup Track Stats: Watkins Glen.
| Finish | Start | Driver | Laps | Led | S1 Fin | S2 Fin | Driver Rating |
| 1 | 2 | Shane Van Gisbergen | 90 | 38 | 8th | 22nd | 143.7 |
| 2 | 9 | Christopher Bell | 90 | 0 | 13th | 3rd | 113.2 |
| 3 | 12 | Chris Buescher | 90 | 5 | 1st | 13th | 105.1 |
| 4 | 10 | William Byron | 90 | 0 | 14th | 2nd | 111.9 |
| 5 | 3 | Chase Briscoe | 90 | 6 | 9th | 24th | 112.2 |
| 6 | 1 | Ryan Blaney | 90 | 35 | 7th | 1st | 124.3 |
| 7 | 19 | Daniel Suarez | 90 | 0 | 23rd | 12th | 89.2 |
| 8 | 15 | Bubba Wallace | 90 | 0 | 20th | 29th | 93.2 |
| 9 | 21 | Tyler Reddick | 90 | 0 | 26th | 15th | 76.7 |
| 10 | 4 | Ross Chastain | 90 | 0 | 11th | 23rd | 99.7 |
| 11 | 18 | A.J. Allmendinger | 90 | 0 | 24th | 4th | 80.8 |
| 12 | 29 | Erik Jones | 90 | 0 | 30th | 18th | 72.3 |
| 13 | 17 | Ryan Preece | 90 | 1 | 3rd | 10th | 84.2 |
| 14 | 11 | Joey Logano | 90 | 0 | 22nd | 31st | 77.7 |
| 15 | 25 | Austin Dillon | 90 | 0 | 27th | 35th | 67.3 |
| 16 | 13 | Austin Cindric | 90 | 0 | 18th | 28th | 82.2 |
| 17 | 33 | Zane Smith | 90 | 0 | 35th | 36th | 56.1 |
| 18 | 8 | Carson Hocevar | 90 | 0 | 17th | 30th | 67.6 |
| 19 | 6 | Michael McDowell | 90 | 0 | 12th | 32nd | 77.7 |
| 20 | 7 | Alex Bowman | 90 | 0 | 2nd | 7th | 77.7 |
| 21 | 35 | Noah Gragson | 90 | 0 | 36th | 16th | 49.7 |
| 22 | 5 | Kyle Busch | 90 | 0 | 15th | 27th | 72.1 |
| 23 | 34 | Ricky Stenhouse Jr. | 90 | 0 | 6th | 8th | 48.5 |
| 24 | 28 | Riley Herbst | 90 | 0 | 34th | 6th | 53.1 |
| 25 | 22 | Denny Hamlin | 90 | 0 | 32nd | 14th | 47.0 |
| 26 | 20 | Chase Elliott | 90 | 0 | 4th | 11th | 55.8 |
| 27 | 23 | Justin Haley | 90 | 0 | 25th | 33rd | 49.9 |
| 28 | 27 | Todd Gilliland | 90 | 0 | 29th | 25th | 46.2 |
| 29 | 36 | Cody Ware | 90 | 0 | 10th | 17th | 37.0 |
| 30 | 32 | Ty Dillon | 90 | 0 | 37th | 37th | 50.2 |
| 31 | 16 | Brad Keselowski | 90 | 5 | 21st | 5th | 80.1 |
| 32 | 30 | John Hunter Nemechek | 90 | 0 | 5th | 21st | 52.8 |
| 33 | 14 | Ty Gibbs | 90 | 0 | 16th | 9th | 63.3 |
| 34 | 31 | Cole Custer | 90 | 0 | -19th | 26th | 32.9 |
| 35 | 24 | Josh Berry | 90 | 0 | 28th | 38th | 38.2 |
| 36 | 37 | Katherine Legge | 89 | 0 | 31st | 19th | 29.7 |
| 37 | 39 | Josh Bilicki | 89 | 0 | 38th | 20th | 25.2 |
| 38 | 38 | J.J. Yeley | 89 | 0 | 33rd | 34th | 26.8 |
| 39 | 26 | Kyle Larson | 75 | 0 | 39th | 39th | 36.3 |
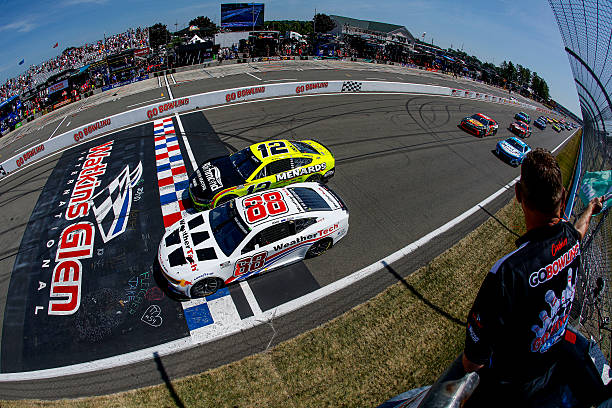
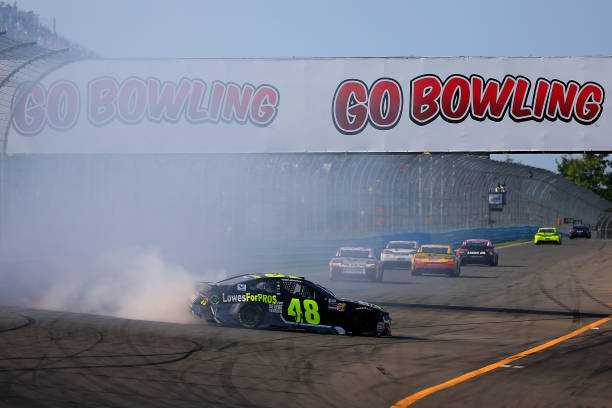
Last year saw Shane Van Gisbergen and Ryan Blaney both lead 35+ laps in the race, the first time 2 drivers led that many laps in a Watkins Glen race since 2012. Photo by Sean Gardner — Getty Images
| Rank | Driver | Avg. Fin. | Best | Worst | Starts |
| 1 | Shane Van Gisbergen | 1.50 | 1st | 2nd | 2 |
| 2 | Christopher Bell | 6.80 | 2nd | 14th | 5 |
| 3 | Carson Hocevar | 10.50 | 3rd | 18th | 2 |
| 4 | A.J. Allmendinger | 10.86 | 1st | 36th | 14 |
| 5 | Zane Smith | 11.00 | 5th | 17th | 2 |
| T6 | Kyle Busch | 12.20 | 1st | 40th | 20 |
| T6 | Tyler Reddick | 12.20 | 7th | 27th | 5 |
| 8 | Chase Elliott | 12.33 | 1st | 32nd | 9 |
| 9 | Daniel Suarez | 12.75 | 3rd | 31st | 8 |
| 10 | William Byron | 13.71 | 1st | 34th | 7 |
| 11 | Austin Cindric | 13.75 | 10th | 16th | 4 |
| 12 | Kyle Larson | 14.64 | 1st | 39th | 11 |
| 13 | Chris Buescher | 14.80 | 1st | 37th | 10 |
| 14 | Ryan Blaney | 15.00 | 5th | 38th | 9 |
| 15 | Joey Logano | 15.63 | 1st | 37th | 16 |
| 16 | Brad Keselowski | 15.87 | 2nd | 35th | 15 |
| 17 | Denny Hamlin | 15.95 | 1st | 37th | 19 |
| T18 | Chase Briscoe | 16.00 | 5th | 35th | 5 |
| T18 | Noah Gragson | 16.00 | 11th | 21st | 2 |
| 20 | Erik Jones | 16.25 | 4th | 33rd | 8 |
| 21 | Jimmie Johnson | 17.17 | 3rd | 40th | 18 |
| 22 | Ross Chastain | 17.71 | 4th | 32nd | 7 |
| 23 | Justin Allgaier | 18.00 | 17th | 19th | 2 |
| 24 | Casey Mears | 18.15 | 4th | 35th | 13 |
| 25 | Ryan Preece | 20.60 | 9th | 36th | 5 |
| 26 | Alex Bowman | 20.89 | 14th | 36th | 9 |
| 27 | Bubba Wallace | 21.14 | 8th | 35th | 7 |
| 28 | Ty Gibbs | 21.50 | 5th | 33rd | 4 |
| 29 | Ricky Stenhouse Jr. | 22.33 | 13th | 38th | 12 |
| 30 | Cole Custer | 22.75 | 11th | 34th | 4 |
| 31 | Todd Gilliland | 23.25 | 11th | 38th | 4 |
| 32 | Riley Herbst | 24.00 | 24th | 24th | 1 |
| 33 | Michael McDowell | 24.81 | 6th | 42nd | 16 |
| 34 | Austin Dillon | 24.82 | 15th | 36th | 11 |
| 35 | Ty Dillon | 25.33 | 16th | 34th | 6 |
| 36 | Anthony Alfredo | 26.00 | 26th | 26th | 1 |
| 37 | John Hunter Nemechek | 26.50 | 21st | 32nd | 2 |
| 38 | Josh Berry | 30.00 | 25th | 35th | 2 |
| 39 | Cody Ware | 32.00 | 29th | 34th | 3 |
| 40 | J.J. Yeley | 33.50 | 18th | 42nd | 6 |
| 41 | Timmy Hill | 38.00 | 38th | 38th | 1 |
– SVG has done so good in his 2 career Watkins Glen starts that unless he finishes 1st his Avg. Finish will be worse after this weekend.
| Best Active Watkins Glen Avg. Driver Rating |
Best Active Watkins Glen Avg. Top 15% |
||||||
| Rank | Driver | Driv. Rate | Starts | Rank | Driver | Top 15% | Starts |
| 1 | Shane Van Gisbergen | 133.8 | 2 | 1 | Shane Van Gisbergen | 92.31 | 2 |
| 2 | Kyle Busch | 102.22 | 20 | 2 | Christopher Bell | 75.00 | 5 |
| 3 | Chase Elliott | 101.82 | 9 | 3 | Kyle Busch | 70.99 | 20 |
| 4 | Christopher Bell | 96.92 | 5 | 4 | William Byron | 69.62 | 7 |
| 5 | William Byron | 92.24 | 7 | 5 | Chase Elliott | 68.35 | 9 |
| 6 | A.J. Allmendinger | 90.77 | 14 | 6 | Jimmie Johnson | 67.73 | 15 |
| 7 | Jimmie Johnson | 90.01 | 15 | 7 | Kyle Larson | 62.60 | 11 |
| 8 | Kyle Larson | 88.65 | 11 | 8 | A.J. Allmendinger | 61.71 | 14 |
| 9 | Brad Keselowski | 87.11 | 15 | 9 | Brad Keselowski | 60.12 | 15 |
| 10 | Denny Hamlin | 85.66 | 19 | 10 | Denny Hamlin | 58.98 | 19 |
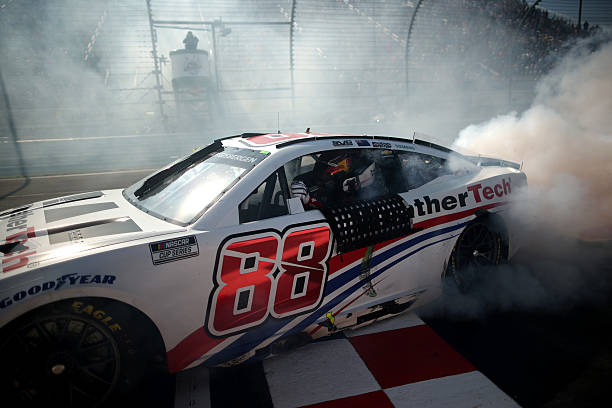
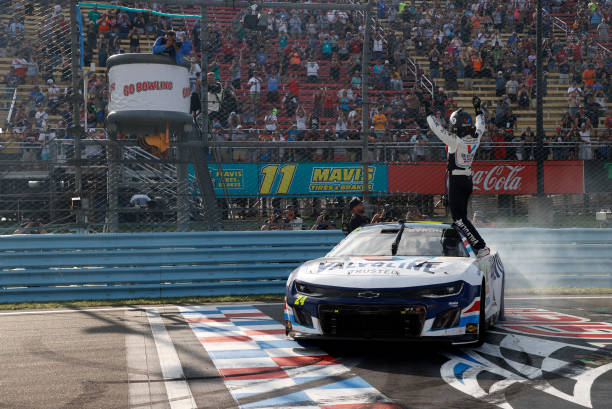
SVG has done more than just finish good here at Watkins Glen in his 2 career Cup races as he’s ran incredibly well, as shown in the tables above. Photo by Chris Graythen — Getty Images
| Best Active Laps Led% | Best Active Laps Completed% | ||||||
| Rank | Driver | Laps Led% | Starts | Rank | Driver | Laps Comp% | Starts |
| 1 | Shane Van Gisbergen | 21.43 | 2 | T1 | Christopher Bell | 100 | 5 |
| 2 | Chase Elliott | 20.94 | 9 | T1 | Tyler Reddick | 100 | 5 |
| 3 | Kyle Busch | 13.79 | 20 | T1 | Austin Cindric | 100 | 4 |
| 4 | William Byron | 10.44 | 7 | T1 | Cole Custer | 100 | 4 |
| 5 | Brad Keselowski | 9.45 | 15 | T1 | Ty Gibbs | 100 | 4 |
| 6 | Ross Chastain | 8.07 | 7 | T1 | Carson Hocevar | 100 | 2 |
| 7 | A.J. Allmendinger | 4.75 | 14 | T1 | John Hunter Nemechek | 100 | 2 |
| 8 | Ryan Blaney | 4.56 | 9 | T1 | Josh Berry | 100 | 2 |
| T1 | Justin Allgaier | 100 | 2 | ||||
| 9 | Kyle Larson | 3.83 | 11 | T1 | Noah Gragson | 100 | 2 |
| T1 | Shane Van Gisbergen | 100 | 2 | ||||
| 10 | Chase Briscoe | 2.88 | 5 | T1 | Zane Smith | 100 | 2 |
| T1 | Riley Herbst | 100 | 1 | ||||
– With Martin Truex Jr. not being an active driver this year it is now Christopher Bell and Tyler Reddick who have the most starts without finishing a lap down here among active drivers.
| Most Active Watkins Glen Starts | Most Active Watkins Glen Poles | ||||
| Rank | Driver | Starts | Rank | Driver | Poles |
| 1 | Kyle Busch | 20 | T1 | Chase Elliott | 2 |
| 2 | Denny Hamlin | 19 | T1 | Denny Hamlin | 2 |
| 3 | Jimmie Johnson | 18 | T1 | Kyle Busch | 2 |
| T4 | Joey Logano | 16 | T4 | A.J. Allmendinger | 1 |
| T4 | Michael McDowell | 16 | |||
| 6 | Brad Keselowski | 15 | T4 | Jimmie Johnson | 1 |
| 7 | Casey Mears | 14 | |||
| 8 | A.J. Allmendinger | 13 | T4 | Ross Chastain | 1 |
| 9 | Ricky Stenhouse Jr. | 12 | |||
| T10 | Austin Dillon | 11 | T4 | Ryan Blaney | 1 |
| T10 | Kyle Larson | 11 | |||
– There are only 6 drivers racing this weekend that have won a Pole at Watkins Glen, which means there are 32 drivers looking to win their first Watkins Glen Pole this weekend.
| Rank | Driver | Wins | Win% | Rank | Driver | Wins | Win% |
| T1 | Chase Elliott | 2 | 22.22 | T4 | Chris Buescher | 1 | 10.00 |
| T1 | Kyle Larson | 2 | 18.18 | T4 | A.J. Allmendinger | 1 | 7.14 |
| T1 | Kyle Busch | 2 | 10.00 | T4 | Joey Logano | 1 | 6.25 |
| T4 | Shane Van Gisbergen | 1 | 50.00 | T4 | Denny Hamlin | 1 | 5.26 |
| T4 | William Byron | 1 | 14.29 |
– Chase Elliott, Kyle Busch, and Kyle Larson are looking to become the winningest active driver here at The Glen with a win this weekend, but SVG and a few others are looking to tie them for that mark instead.
| Most Active Watkins Glen Top 3’s | Best Active Watkins Glen Top 3% | |||||
| Rank | Driver | Top 3’s | Rank | Driver | Top3% | Top3’s |
| 1 | Kyle Busch | 5 | 1 | Shane Van Gisbergen | 100 | 2 |
| T2 | Brad Keselowski | 4 | 2 | Carson Hocevar | 50.00 | 1 |
| T2 | Denny Hamlin | 4 | 3 | Christopher Bell | 40.00 | 2 |
| T4 | Chase Elliott | 3 | 4 | Chase Elliott | 33.33 | 3 |
| T4 | Joey Logano | 3 | 5 | Brad Keselowski | 26.67 | 4 |
| T6 | Shane Van Gisbergen | 2 | 6 | Kyle Busch | 25.00 | 5 |
| T6 | Christopher Bell | 2 | 7 | Denny Hamlin | 21.05 | 4 |
| T6 | Chris Buescher | 2 | 7 | Chris Buescher | 20.00 | 2 |
| T6 | Kyle Larson | 2 | 9 | Joey Logano | 18.75 | 3 |
| T6 | A.J. Allmendinger | 2 | 10 | Kyle Larson | 18.18 | 2 |
| T6 | Jimmie Johnson | 2 | ||||
– Shane Van Gisbergen and Carson Hocevar have only made 2 career starts here at Watkins Glen, but they’ve been mighty impressive as they lead the Top 3% table above and Top 5% table below.
| Most Active Watkins Glen Top 5’s | Best Active Watkins Glen Top 5% | |||||
| Rank | Driver | Top 5’s | Rank | Driver | Top5% | Top5’s |
| 1 | Kyle Busch | 7 | 1 | Shane Van Gisbergen | 100 | 2 |
| 2 | Denny Hamlin | 6 | T2 | Carson Hocevar | 50.00 | 1 |
| 3 | A.J. Allmendinger | 5 | T2 | Zane Smith | 50.00 | 1 |
| T4 | Chase Elliott | 4 | 4 | Chase Elliott | 44.44 | 4 |
| T4 | Brad Keselowski | 4 | 5 | Christopher Bell | 40.00 | 2 |
| T4 | Joey Logano | 4 | 6 | Daniel Suarez | 37.50 | 3 |
| T4 | Jimmie Johnson | 4 | 7 | A.J. Allmendinger | 35.71 | 5 |
| T8 | Daniel Suarez | 3 | 8 | Kyle Busch | 35.00 | 7 |
| T8 | Kye Larson | 3 | 9 | Denny Hamlin | 31.58 | 6 |
| T10 | 5 drivers tied | 2 | 10 | Christopher Bell | 28.57 | 2 |
| Most Active Watkins Glen Top 10’s | Best Active Watkins Glen Top 10% | |||||
| Rank | Driver | Top 10’s | Rank | Driver | Top 10% | Top 10’s |
| 1 | Kyle Busch | 13 | 1 | Shane Van Gisbergen | 100 | 2 |
| 2 | Denny Hamlin | 9 | T2 | Christopher Bell | 80.00 | 4 |
| T3 | A.J. Allmendinger | 8 | T2 | Tyler Reddick | 80.00 | 4 |
| T3 | Jimmie Johnson | 8 | 4 | Kyle Busch | 65.00 | 13 |
| 5 | Joey Logano | 7 | 5 | Chase Briscoe | 60.00 | 3 |
| 6 | Brad Keselowski | 6 | T6 | A.J. Allmendinger | 57.14 | 8 |
| T6 | William Byron | 57.14 | 4 | |||
| 7 | Kyle Larson | 5 | T8 | Daniel Suarez | 50.00 | 4 |
| T8 | Erik Jones | 50.00 | 4 | |||
| T8 | 8 drivers tied | 4 | T8 | Carson Hocevar | 50.00 | 1 |
| T8 | Zane Smith | 50.00 | 1 | |||
– The last time any driver in the “Most Top 10’s” table above got a Top 10 at Watkins Glen was in 2023, meanwhile 5 of the 7 drivers in the “Top 10%” table above got a Top 10 here last year.
| Rank | Driver | Stage Wins | Stage Win% | Rank | Driver | Stage Wins | Stage Win% |
| 1 | Chase Elliott | 3 | 18.75 | T3 | Chris Buescher | 1 | 6.25 |
| 2 | Joey Logano | 2 | 12.50 | T3 | Daniel Suarez | 1 | 6.25 |
| T3 | Chase Briscoe | 1 | 10.00 | T3 | Kyle Busch | 1 | 6.25 |
| T3 | Ross Chastain | 1 | 7.14 | T3 | Michael McDowell | 1 | 6.25 |
| T3 | William Byron | 1 | 7.14 | T3 | Ryan Blaney | 1 | 6.25 |
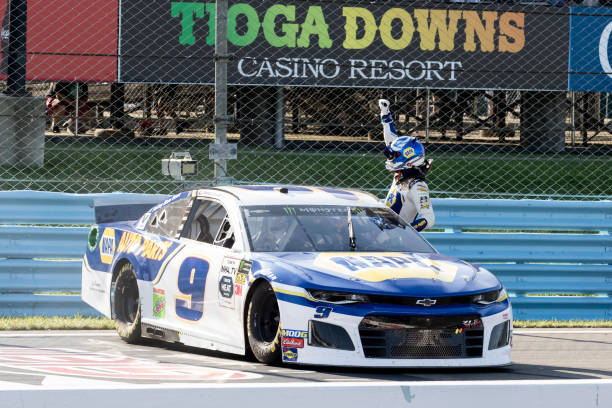
Chase Elliott won 3 straight stages here from 2018-2019, but as you can see in the table above, those are his only Stage Wins here. Photo by David Hahn — Icon Sportswire via Getty Images
| Most Active Watkins Glen Stage T10’s | Best Active Watkins Glen Stage T10% | |||||
| Rank | Driver | Stage T10’s | Rank | Driver | Stage T10% | Stage T10’s |
| 1 | Kyle Busch | 10 | 1 | Kyle Busch | 62.50 | 10 |
| T2 | Chase Elliott | 9 | T2 | Chase Elliott | 56.25 | 9 |
| T2 | Denny Hamlin | 9 | T2 | Denny Hamlin | 56.25 | 9 |
| T2 | Kyle Larson | 9 | T2 | Kyle Larson | 56.25 | 9 |
| T5 | Alex Bowman | 7 | T5 | Alex Bowman | 50.00 | 7 |
| T5 | William Byron | 7 | T5 | William Byron | 50.00 | 7 |
| T7 | A.J. Allmendinger | 6 | T5 | A.J. Allmendinger | 50.00 | 6 |
| T7 | Erik Jones | 6 | T5 | Chase Briscoe | 50.00 | 5 |
| T7 | Joey Logano | 6 | T5 | Christopher Bell | 50.00 | 5 |
| T10 | Chase Briscoe | 5 | T5 | Ty Gibbs | 50.00 | 4 |
| T10 | Christopher Bell | 5 | T5 | Jimmie Johnson | 50.00 | 3 |
| T10 | Brad Keselowski | 5 | T5 | Shane Van Gisbergen | 50.00 | 2 |
| T10 | Ryan Blaney | 5 | T5 | Riley Herbst | 50.00 | 1 |
– Kyle Busch is way back in the 2026 Point Standings, but this weekend could help some as he’s been the best active driver at getting Stage T10’s here.
| Most Active Watkins Glen Starts without Win | Most Active Watkins Glen Starts without Pole | ||||
| Rank | Driver | Starts | Rank | Driver | Starts |
| 1 | Jimmie Johnson | 18 | T1 | Joey Logano | 16 |
| 2 | Michael McDowell | 16 | T1 | Michael McDowell | 16 |
| 3 | Brad Keselowski | 15 | 3 | Brad Keselowski | 15 |
| 4 | Casey Mears | 13 | 4 | Casey Mears | 13 |
| 5 | Ricky Stenhouse Jr. | 12 | 5 | Ricky Stenhouse Jr. | 12 |
| 6 | Austin Dillon | 11 | T6 | Austin Dillon | 11 |
| T7 | Alex Bowman | 9 | T6 | Kyle Larson | 11 |
| T7 | Ryan Blaney | 9 | 8 | Chris Buescher | 10 |
| T9 | Daniel Suarez | 8 | 9 | Alex Bowman | 9 |
| T9 | Erik Jones | 8 | T10 | Daniel Suarez | 8 |
| T10 | Erik Jones | 8 | |||
Jimmie Johnson had a lot of success in his Cup career leading to 83 wins, but in 18 starts here he could never get a win at Watkins Glen. Photo by Chris Trotman — Getty Images
| Most Active Watkins Glen Starts without Top 3 | Most Active Watkins Glen Starts without Top 5 | ||||
| Rank | Driver | Starts | Rank | Driver | Starts |
| 1 | Michael McDowell | 16 | 1 | Michael McDowell | 16 |
| 2 | Casey Mears | 13 | 2 | Ricky Stenhouse Jr. | 12 |
| 3 | Ricky Stenhouse Jr. | 12 | 3 | Austin Dillon | 11 |
| 4 | Austin Dillon | 11 | 4 | Alex Bowman | 9 |
| T5 | Alex Bowman | 9 | 5 | Bubba Wallace | 7 |
| T5 | Ryan Blaney | 9 | |||
– The top 4 drivers in the “Without Top 5” table above are all outside of the Chase coming into this weekend, so getting their first Top 5 here could do them a lot of good in the Point Standings.
| Rank | Driver | Starts |
| 1 | Ricky Stenhouse Jr. | 12 |
| 2 | Austin Dillon | 11 |
| 3 | Alex Bowman | 9 |
| T4 | J.J. Yeley | 6 |
| T4 | Ty Dillon | 6 |
– Austin Dillon and Ricky Stenhouse Jr. have never been able to find much success at Watkins Glen as they are the only drivers on every “without” list above.
| Most Active Watkins Glen Stages without Stage Win | Most Active Watkins Glen Stages without Stage T10 | ||||
| Rank | Driver | Stages | Rank | Driver | Stages |
| T1 | Austin Dillon | 16 | T1 | Carson Hocevar | 4 |
| T1 | Brad Keselowski | 16 | T1 | Josh Berry | 4 |
| T1 | Denny Hamlin | 16 | T1 | Noah Gragson | 4 |
| T1 | Erik Jones | 16 | |||
| T1 | Kyle Larson | 16 | T1 | Zane Smith | 4 |
| T1 | Ricky Stenhouse Jr. | 16 | |||
| T7 | Alex Bowman | 14 | T5 | Anthony Alfredo | 2 |
| T7 | Bubba Wallace | 14 | |||
| T9 | A.J. Allmendinger | 12 | T5 | J.J. Yeley | 2 |
| T9 | Ty Dillon | 12 | |||
– Out of 38 active drivers to make a start here with stages in the race, only the 6 in the “Without Stage T10” table above have yet to get a Stage T10.
| Driver | Streak | Category | Driver | Streak | Category |
| Shane Van Gisbergen | 2 | Top 2’s | Alex Bowman | 4 | Stage T10’s |
| Chris Buescher | 2 | Top 3’s | Ryan Preece | 3 | Stage T10’s |
| Chris Buescher | 4 | Top 10’s | Ricky Stenhouse Jr. | 2 | Stage T10’s |
| Chase Briscoe | 2 | Top 10’s | Ryan Blaney | 2 | Stage T10’s |
| Ross Chastain | 2 | Top 10’s |
| Rank | Race | Laps Led% | Driver | Fin. | Rank | Race | Laps Led% | Driver | Fin. |
| 1 | 2023-25 | 73.33 | William Byron | 1st | 7 | 2023-25 | 18.89 | Michael McDowell | 36th |
| 2 | 2024-28 | 55.43 | Ross Chastain | 4th | 8 | 2022-25 | 16.67 | Joey Logano | 3rd |
| 3 | 2025-24 | 42.22 | Shane Van Gisbergen | 1st | 9 | 2022-25 | 15.56 | Michael McDowell | 6th |
| 4 | 2025-24 | 38.89 | Ryan Blaney | 6th | T10 | 2022-25 | 7.78 | Cole Custer | 11th |
| 5 | 2022-25 | 32.22 | Chase Elliott | 4th | T10 | 2022-25 | 7.78 | Chase Briscoe | 25th |
| 6 | 2024-28 | 20.65 | Chris Buescher | 1st |
William Byron dominated the 2023 race here as he leads the Laps Led% table above by almost 20 percentage points and leads the Driver Rating table below by over 5 points. Photo by Chris Graythen — Getty Images
| Rank | Race | Driver |
Driv. Rate |
Fin. | Rank | Race | Driver |
Driv. Rate |
Fin. |
| 1 | 2023-25 | William Byron | 149.3 | 1st | 6 | 2024-28 | Shane Van Gisbergen | 123.9 | 2nd |
| 2 | 2025-24 | Shane Van Gisbergen | 143.7 | 1st | 7 | 2023-25 | Denny Hamlin | 119.8 | 2nd |
| 3 | 2024-28 | Ross Chastain | 136.6 | 4th | 8 | 2022-25 | Michael McDowell | 119.3 | 6th |
| 4 | 2022-25 | Chase Elliott | 124.8 | 4th | 9 | 2024-28 | Chris Buescher | 117.7 | 1st |
| 5 | 2025-24 | Ryan Blaney | 124.3 | 6th | 10 | 2023-25 | Ty Gibbs | 114.4 | 5th |
| Rank | Race | Driver |
Top 15% | Fin. | Rank | Race | Driver |
Top 15% | Fin. |
| T1 | 2023-25 | William Byron | 100 | 1st | 6 | 2022-25 | Michael McDowell | 97.78 | 6th |
| T1 | 2023-25 | Denny Hamlin | 100 | 2nd | 7 | 2024-28 | Michael McDowell | 94.57 | 7th |
| T1 | 2023-25 | Christopher Bell | 100 | 3rd | 8 | 2022-25 | Chase Elliott | 94.44 | 4th |
| T1 | 2023-25 | A.J. Allmendinger | 100 | 4th | 9 | 2023-25 | Joey Logano | 93.33 | 10th |
| T1 | 2023-25 | Ty Gibbs | 100 | 5th | 10 | 2025-24 | Shane Van Gisbergen | 93.33 | 1st |
| 6 | 2023-25 | Bubba Wallace | 98.89 | 12th |
– Michael McDowell has been good at running laps in the Top 15 at Watkins Glen in the Next Gen car as he is the only driver in the table above twice.
| Best Next Gen Avg. Fin. by Starting Position (1-39) |
Worst Next Gen Avg. Fin. by Starting Position (1-39) |
||||
| Rank | Start Pos. | Avg. Fin | Rank | Start Pos. | Avg. Fin |
| 1 | 1st | 4.00 | 1 | 39th | 35.50 |
| 2 | 2nd | 5.75 | 2 | 26th | 33.75 |
| 3 | 9th | 8.00 | 3 | 36th | 32.00 |
| 4 | 12th | 9.50 | 4 | 27th | 31.50 |
| 5 | 7th | 11.75 | 5 | 37th | 30.33 |
| 6 | 3rd | 12.25 | 6 | 34th | 29.00 |
| 7 | 29th | 12.75 | T7 | 16th | 28.75 |
| T8 | 8th | 13.00 | T7 | 30th | 28.75 |
| T8 | 21st | 13.00 | 9 | 38th | 27.00 |
| 10 | 4th | 13.75 | 10 | 32nd | 26.75 |
– The tables above aren’t too shocking as for the most part starting good gets you a good finish and starting bad gets you a bad finish here.
| Best Next Gen Watkins Glen Avg. Driver Rating |
Best Next Gen Watkins Glen Avg. Top 15% |
||||||
| Rank | Driver | Driv. Rate | Starts | Rank | Driver | Top 15% | Starts |
| 1 | Shane Van Gisbergen | 133.80 | 2 | 1 | Shane Van Gisbergen | 92.31 | 2 |
| 2 | Chris Buescher | 103.60 | 4 | 2 | Michael McDowell | 79.83 | 4 |
| 3 | Michael McDowell | 100.18 | 4 | 3 | Christopher Bell | 75.69 | 4 |
| 4 | Christopher Bell | 95.98 | 4 | 4 | Chris Buescher | 71.55 | 4 |
| 5 | William Byron | 95.13 | 4 | 5 | Joey Logano | 70.99 | 4 |
| 6 | Ross Chastain | 93.18 | 4 | 6 | William Byron | 65.47 | 4 |
| 7 | Joey Logano | 90.83 | 4 | 7 | Chase Elliott | 60.77 | 4 |
| 8 | Carson Hocevar | 85.60 | 2 | 8 | Ross Chastain | 56.35 | 4 |
| 9 | Chase Elliott | 82.10 | 4 | 9 | Carson Hocevar | 55.49 | 2 |
| 10 | A.J. Allmendinger | 81.73 | 4 | 10 | Tyler Reddick | 54.97 | 4 |
– This may come as a shock, but SVG just may be the man to beat this weekend as he is atop both tables above and both tables below.
| Best Next Gen Watkins Glen Avg. Finish | Best Next Gen Watkins Glen Laps Led% | ||||||
| Rank | Driver | Avg. Fin. | Starts | Rank | Driver | Laps Led% | Starts |
| 1 | Shane Van Gisbergen | 1.50 | 2 | 1 | Shane Van Gisbergen | 21.43 | 2 |
| 2 | Chris Buescher | 5.00 | 4 | 2 | William Byron | 18.23 | 4 |
| 3 | Christopher Bell | 6.75 | 4 | 3 | Ross Chastain | 14.09 | 4 |
| T4 | Carson Hocevar | 10.50 | 2 | 4 | Michael McDowell | 10.50 | 4 |
| T4 | Joey Logano | 10.50 | 4 | 5 | Ryan Blaney | 9.67 | 4 |
| 6 | Zane Smith | 11.00 | 2 | 6 | Chase Elliott | 8.01 | 4 |
| 7 | Daniel Suarez | 11.75 | 4 | 7 | Chris Buescher | 6.63 | 4 |
| 8 | Tyler Reddick | 12.75 | 4 | 8 | Joey Logano | 5.80 | 4 |
| 9 | Ryan Preece | 13.00 | 3 | 9 | Chase Briscoe | 3.59 | 4 |
| 10 | A.J. Allmendinger | 13.25 | 4 | 10 | Cole Custer | 2.59 | 3 |
| Next Gen Watkins Glen Win List | Next Gen Watkins Glen Pole List | |||||
| Rank | Driver | Wins | Win% | Rank | Driver | Poles |
| T1 | Shane Van Gisbergen | 1 | 50.00 | T1 | Chase Elliott | 1 |
| T1 | Chris Buescher | 1 | 25.00 | T1 | Denny Hamlin | 1 |
| T1 | Kyle Larson | 1 | 25.00 | T1 | Ross Chastain | 1 |
| T1 | William Byron | 1 | 25.00 | T1 | Ryan Blaney | 1 |
– No driver has won both a Pole and a race in the Next Gen car at Watkins Glen as the 8 different spots in tables above hold 8 different drivers.
| Rank | Driver | Top 3’s | Top 3% |
| T1 | Shane Van Gisbergen | 2 | 100 |
| T1 | Chris Buescher | 2 | 50.00 |
| T1 | Christopher Bell | 2 | 50.00 |
| T1 | Carson Hocevar | 1 | 50.00 |
| T1 | A.J. Allmendinger | 1 | 25.00 |
| T1 | Denny Hamlin | 1 | 25.00 |
| T1 | Joey Logano | 1 | 25.00 |
| T1 | Kyle Larson | 1 | 25.00 |
| T1 | William Byron | 1 | 25.00 |
– Last year the entire Top 3 finishers (SVG, Bell, Buescher) became the first drivers to get multiple Top 3 finishes here at The Glen in the Next Gen car.
| Most Next Gen Watkins Glen Top 5’s | Most Next Gen Watkins Glen Top 10’s | ||||||
| Rank | Driver | Top 5’s | Top 5% | Rank | Driver | Top 10’s | Top 10% |
| T1 | Shane Van Gisbergen | 2 | 100 | 1 | Chris Buescher | 4 | 100 |
| T1 | A.J. Allmendinger | 2 | 50.00 | T2 | Christopher Bell | 3 | 75.00 |
| T1 | Chris Buescher | 2 | 50.00 | T2 | Tyler Reddick | 3 | 75.00 |
| T1 | Christopher Bell | 2 | 50.00 | T4 | Shane Van Gisbergen | 2 | 100 |
| T1 | William Byron | 2 | 50.00 | T4 | A.J. Allmendinger | 2 | 50.00 |
| T6 | Carson Hocevar | 1 | 50.00 | T4 | Chase Briscoe | 2 | 50.00 |
| T6 | Zane Smith | 1 | 50.00 | T4 | Daniel Suarez | 2 | 50.00 |
| T6 | 8 drivers tied with same % | 1 | 25.00 | T4 | Joey Logano | 2 | 50.00 |
| T4 | Michael McDowell | 2 | 50.00 | ||||
| T4 | Ross Chastain | 2 | 50.00 | ||||
| T4 | Ryan Blaney | 2 | 50.00 | ||||
| T4 | William Byron | 2 | 50.00 | ||||
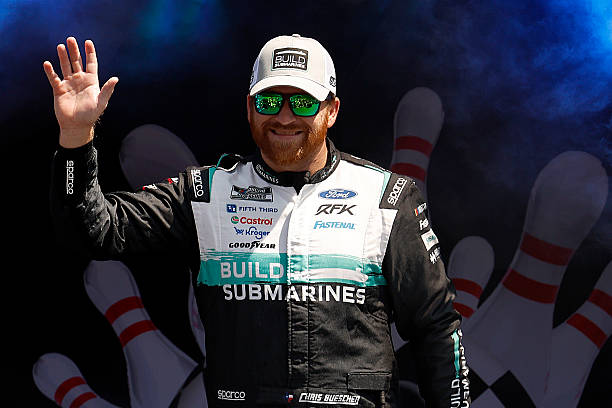
Chris Buescher has been amazing in the Next Gen at Watkins Glen as he is the only driver that has finished all 4 Next Gen races here in the Top 10. Photo by Sean Gardner — Getty Images
| Most Next Gen Watkins Glen Stage Wins | Most Next Gen Watkins Glen Stage T10’s | ||||||
| Rank | Driver | Stage Wins | Stage Win% | Rank | Driver | Stage T10’s | Stage T10% |
| T1 | Martin Truex Jr. | 1 | 16.67 | T1 | A.J. Allmendinger | 4 | 50.00 |
| T1 | Chase Briscoe | 1 | 12.50 | T1 | Alex Bowman | 4 | 50.00 |
| T1 | Chris Buescher | 1 | 12.50 | T1 | Chase Briscoe | 4 | 50.00 |
| T1 | Joey Logano | 1 | 12.50 | T1 | Chase Elliott | 4 | 50.00 |
| T1 | Michael McDowell | 1 | 12.50 | T1 | Christopher Bell | 4 | 50.00 |
| T1 | Ross Chastain | 1 | 12.50 | T1 | Kyle Busch | 4 | 50.00 |
| T1 | Kyle Larson | 4 | 50.00 | ||||
| T1 | Ryan Blaney | 1 | 12.50 | T1 | Ty Gibbs | 4 | 50.00 |
| T1 | William Byron | 4 | 50.00 | ||||
| T1 | William Byron | 1 | 12.50 | T10 | Ryan Preece | 3 | 50.00 |
| T10 | 4 drivers tied with same % | 3 | 37.50 | ||||
– No driver in the Next Gen at Watkins Glen has gotten a Stage T10 in more than half of the stages they’ve ran, and no driver has more than 1 Stage Win in the Next Gen car here either.