
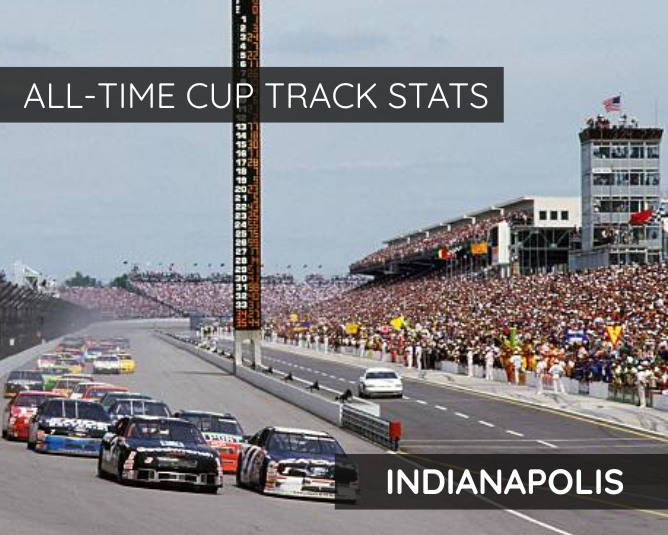
In this post you will only find all-time stats, if you are looking for only active drivers stats or Next Gen stats check out my next article Active/Next Gen Cup Track Stats: Indianapolis.
Active means any driver who started a race in the 2026 Cup Series season.
First Winner: Jeff Gordon 08/06/1994
Most Recent Winner: Bubba Wallace 07/27/2025
| Rank | Race | Start Pos. | Driver | Rank | Race | Start Pos. | Driver |
| 1 | 2001-21 | 27 | Jeff Gordon | 6 | 2011-20 | 15 | Paul Menard |
| 2 | 1996-19 | 24 | Dale Jarrett | 7 | 2007-20 | 14 | Tony Stewart |
| 3 | 2005-21 | 22 | Tony Stewart | 8 | 1995-19 | 13 | Dale Earnhardt |
| 4 | 2017-20 | 19 | Kasey Kahne | T9 | 2004-21 | 11 | Jeff Gordon |
| 5 | 2009-20 | 16 | Jimmie Johnson | T9 | 2020-16 | 11 | Kevin Harvick |
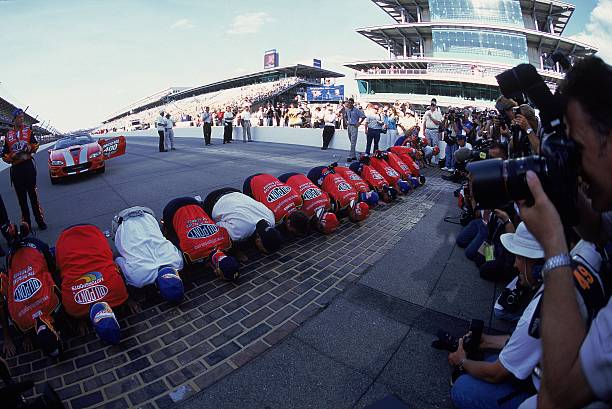
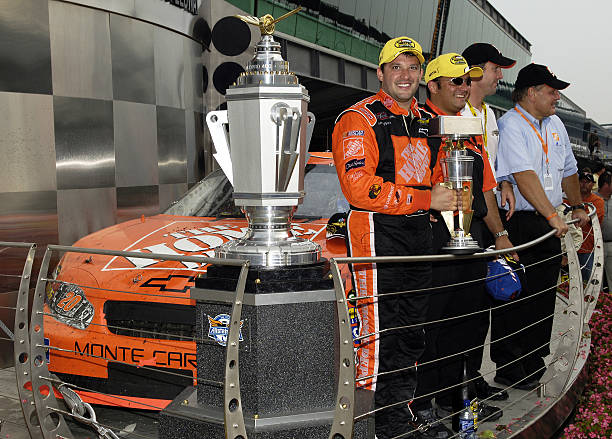
Jeff Gordon holds the record for worst starting position by a winner at Indianapolis, above. In addition, he also holds the record for worst finish by a Pole winner at Indianapolis, below. Image Credit: Jonathan Ferrey — Allsport
| Rank | Race | Finish | Driver | Rank | Race | Finish | Driver |
| 1 | 1996-19 | 37 | Jeff Gordon | 6 | 2011-20 | 23 | David Ragan |
| 2 | 2017-20 | 34 | Kyle Busch | 7 | 1994-19 | 22 | Rick Mast |
| T3 | 2005-21 | 32 | Elliott Sadler | 8 | 2000-20 | 21 | Ricky Rudd |
| T3 | 2010-20 | 32 | Juan Pablo Montoya | 9 | 2025-22 | 18 | Chase Briscoe |
| 5 | 2004-21 | 26 | Casey Mears | 10 | 2006-21 | 15 | Jeff Burton |
| Race | Driver | Race | Driver |
| 2003-21 | Kevin Harvick | 2016-20 | Kyle Busch |
| 2008-20 | Jimmie Johnson | 2019-26 | Kevin Harvick |
| 2013-20 | Ryan Newman |
– It took 10 races for a Pole winner to win the race at Indianapolis, but in the last 18 races qualifying was held here the Pole winner has won the race 5 times.
| Race | Driver | Race Finish |
| 2017-20 | Kyle Busch | 34th |
| Drivers to win both Stages and Race | Drivers to win Pole, both Stages & Race | ||
| Race | Driver | Race | Driver |
| – | – | – | – |
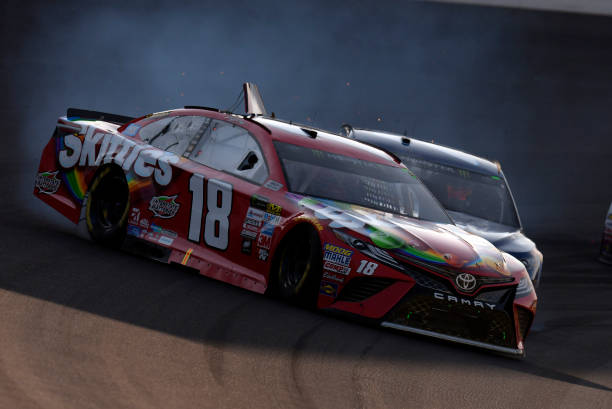
There have only been 6 races at Indianapolis to feature stages, but in the first of these races Kyle Busch swept both stages. However, this was how his race ended that day. Photo by Michael Allio — Icon Sportswire via Getty Images
| Best Laps Led% by Winner | Worst Laps Led% by Winner | ||||||
| Rank | Race | Laps Led% | Driver | Rank | Race | Laps Led% | Driver |
| 1 | 2016-20 | 87.65 | Kyle Busch | 1 | 2024.22 | 4.79 | Kyle Larson |
| 2 | 2004-21 | 77.02 | Jeff Gordon | 2 | 2018-26 | 5.63 | Brad Keselowski |
| 3 | 2019-26 | 73.75 | Kevin Harvick | 3 | 1996-19 | 6.88 | Dale Jarrett |
| 4 | 1999-20 | 73.13 | Dale Jarrett | 4 | 2017-20 | 7.19 | Kasey Kahne |
| 5 | 2012-20 | 61.88 | Jimmie Johnson | 5 | 1997-19 | 9.38 | Ricky Rudd |
| 6 | 1998-19 | 60.63 | Jeff Gordon | 6 | 2010-20 | 10.00 | Jamie McMurray |
| T7 | 1994-19 | 58.13 | Jeff Gordon | 7 | 2015-20 | 11.59 | Kyle Busch |
| T7 | 2002-21 | 58.13 | Bill Elliott | T8 | 2000-20 | 13.13 | Bobby Labonte |
| 9 | 2008-20 | 44.38 | Jimmie Johnson | T8 | 2011-20 | 13.13 | Paul Menard |
| 10 | 2020-16 | 42.24 | Kevin Harvick | 10 | 2009-20 | 15.00 | Jimmie Johnson |
– You’ll want to lead a handful of laps this weekend if you want to win as the least amount of laps led by a winner here at Indy is 8 laps.
| Rank | Race | Laps Led% | Driver | Fin. | Rank | Race | Laps Led% | Driver | Fin. |
| 1 | 2016-20 | 87.65 | Kyle Busch | 1st | 6 | 2000-20 | 68.75 | Rusty Wallace | 2nd |
| 2 | 2004-21 | 77.02 | Jeff Gordon | 1st | 7 | 2012-20 | 61.88 | Jimmie Johnson | 1st |
| 3 | 2019-26 | 73.75 | Kevin Harvick | 1st | 8 | 1998-19 | 60.63 | Jeff Gordon | 1st |
| 4 | 1999-20 | 73.13 | Dale Jarrett | 1st | T9 | 1994-19 | 58.13 | Jeff Gordon | 1st |
| 5 | 2009-20 | 72.50 | Juan Pablo Montoya | 11th | T9 | 2002-21 | 58.13 | Bill Elliott | 1st |
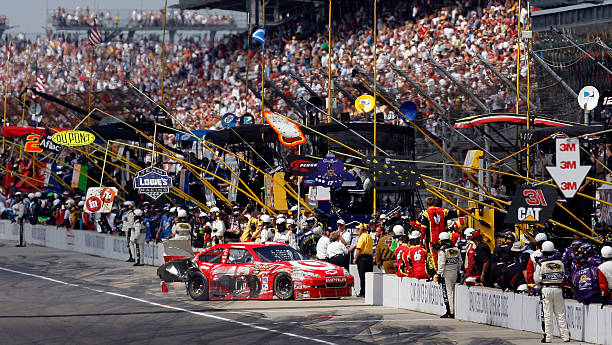
Only 4 times has a driver led over half the race here at Indianapolis and not went on to finish in the Top 10, but two of those times were by Juan Pablo Montoya (One of the times is the picture above where he led 53.75% of the laps and finished 32nd in 2010). Photo by Tom Pennington — Getty Images for NASCAR
| Rank | Race | Driver |
Driver Rating |
Fin. | Rank | Race | Driver |
Driver Rating |
Fin. |
| T1 | 2012-20 | Jimmie Johnson | 150.0 | 1st | 6 | 2020-16 | Kevin Harvick | 142.3 | 1st |
| T1 | 2016-20 | Kyle Busch | 150.0 | 1st | 7 | 2014-20 | Jeff Gordon | 138.4 | 1st |
| T1 | 2019-26 | Kevin Harvick | 150.0 | 1st | 8 | 2013-20 | Jimmie Johnson | 138.3 | 2nd |
| 4 | 2008-20 | Jimmie Johnson | 147.3 | 1st | 9 | 2011-20 | Jeff Gordon | 136.0 | 2nd |
| 5 | 2007-20 | Tony Stewart | 146.0 | 1st | 10 | 2015-20 | Kevin Harvick | 135.5 | 3rd |
– In the 18 races here since Driver Rating was introduced to the sport 3 times a driver has gotten a perfect Driver Rating (150.0), which is the same amount as drivers to get a Driver Rating between 140 and 149.9.
| Race | Driver | Finish | Race | Driver | Finish |
| 2010-20 | Jamie McMurray | 1st | 2013-20 | Ryan Newman | 1st |
| 2010-20 | Greg Biffle | 3rd | 2013-20 | Jimmie Johnson | 2nd |
| 2010-20 | Clint Bowyer | 4th | 2013-20 | Tony Stewart | 4th |
| 2012-20 | Jimmie Johnson | 1st | 2016-20 | Kyle Busch | 1st |
| 2012-20 | Greg Biffle | 3rd | 2019-26 | Ryan Blaney | 7th |
– Only twice in the last 9 Indianapolis Cup races has a driver ran every lap in the Top 15, so don’t expect anyone to do so this weekend.
| Most Lead Lap cars at finish of race | Fewest Lead Lap cars at finish of race | ||||
| Rank | Race | # of cars | Rank | Race | # of cars |
| 1 | 2008-20 | 36 | 1 | 2000-20 | 14 |
| 2 | 2006-21 | 35 | T2 | 1994-19 | 16 |
| T3 | 2005-21 | 31 | T2 | 2017-20 | 16 |
| T3 | 2011-20 | 31 | T4 | 1995-19 | 19 |
| 5 | 2002-21 | 30 | T4 | 2016-20 | 19 |
| T6 | 2012-20 | 28 | T4 | 2020-16 | 19 |
| T6 | 2015-20 | 28 | T7 | 1996-19 | 21 |
| 8 | 2004-21 | 27 | T7 | 1999-20 | 21 |
| 9 | 2014-20 | 26 | T7 | 2003-21 | 21 |
| 10 | 2010-20 | 25 | T7 | 2007-20 | 21 |
– Based on the tables above expect a lot of cars to be on the lead lap at the end of the Cup race this weekend as 23 of the 29 Cup races here have seen 20+ drivers finish on the lead lap.
| Best Avg. Fin. by Starting Position (1-40) |
Worst Avg. Fin. by Starting Position (1-40) |
||||
| Rank | Start Pos. | Avg. Fin | Rank | Start Pos. | Avg. Fin |
| 1 | 2nd | 12.03 | 1 | 34th | 29.31 |
| 2 | 7th | 12.48 | 2 | 39th | 28.69 |
| 3 | 1st | 12.72 | 3 | 40th | 28.19 |
| 4 | 8th | 14.17 | 4 | 32nd | 27.17 |
| 5 | 5th | 15.41 | 5 | 36th | 26.41 |
| 6 | 9th | 15.52 | 6 | 37th | 26.34 |
| 7 | 6th | 16.62 | 7 | 30th | 25.69 |
| 8 | 3rd | 16.97 | 8 | 28th | 25.59 |
| 9 | 11th | 17.83 | 9 | 35th | 25.38 |
| 10 | 19th | 17.86 | 10 | 38th | 25.03 |
– The tables above make it clear that starting position will most likely matter this weekend as 8 of the spots in the “best” table are Top 10 starting positions, and 9 of the spots in the “worst” table are starting spots of 30th or worse.
| Best Avg. Driver Rating (since 2005)(3+ starts) |
Best Avg. Top 15% (since 2005)(3+ starts) |
||||||
| Rank | Driver | Driv. Rate | Starts | Rank | Driver | Top 15% | Starts |
| 1 | Kevin Harvick | 104.59 | 16 | 1 | Kyle Larson | 83.89 | 8 |
| 2 | Kyle Larson | 100.66 | 8 | 2 | Matt Kenseth | 79.60 | 15 |
| 3 | Tony Stewart | 100.43 | 12 | 3 | Kevin Harvick | 75.29 | 16 |
| 4 | Kyle Busch | 100.42 | 18 | 4 | Mark Martin | 75.14 | 9 |
| 5 | Matt Kenseth | 99.83 | 15 | 5 | Kyle Busch | 72.06 | 18 |
| 6 | Tyler Reddick | 98.40 | 3 | 6 | Tyler Reddick | 71.37 | 3 |
| 7 | Mark Martin | 97.91 | 9 | 7 | Denny Hamlin | 69.64 | 17 |
| 8 | Jeff Gordon | 97.58 | 12 | 8 | Tony Stewart | 69.44 | 12 |
| 9 | Jimmie Johnson | 96.07 | 16 | 9 | Jeff Gordon | 69.03 | 12 |
| 10 | Denny Hamlin | 94.96 | 17 | 10 | Christopher Bell | 68.15 | 3 |
– Kevin Harvick was great in his career at Indianapolis as he is the only driver that is top 7 in both tables above and both tables below.
| Best Avg. Fin. All-time (5+ Indianapolis starts) |
Best Laps Led% All-time (5+ Indianapolis starts) |
||||||
| Rank | Driver | Avg. Fin. | Starts | Rank | Driver | Laps Led% | Starts |
| 1 | Kevin Harvick | 8.55 | 20 | 1 | Juan Pablo Montoya | 15.86 | 8 |
| 2 | Tony Stewart | 9.72 | 18 | 2 | Jeff Gordon | 14.29 | 23 |
| 3 | Jeff Gordon | 10.04 | 23 | 3 | Ernie Irvan | 14.25 | 5 |
| 4 | Rusty Wallace | 10.25 | 12 | 4 | Kevin Harvick | 12.07 | 20 |
| 5 | Dale Earnhardt | 10.43 | 7 | 5 | Kyle Busch | 11.28 | 18 |
| 6 | Bubba Wallace | 11.20 | 5 | 6 | Jimmie Johnson | 9.97 | 19 |
| 7 | Ernie Irvan | 11.80 | 5 | 7 | Dale Jarrett | 8.94 | 13 |
| 8 | Matt Kenseth | 12.15 | 20 | 8 | Tony Stewart | 7.84 | 18 |
| T9 | Bill Elliott | 12.38 | 16 | 9 | Rusty Wallace | 7.70 | 12 |
| T9 | Kyle Larson | 12.38 | 8 | 10 | Kasey Kahne | 7.52 | 14 |
| Most Indianapolis Starts All-time |
Best Laps Completed% (5+ Indianapolis starts) |
|||||
| Rank | Driver | Starts | Rank | Driver | Lap Comp% | Starts |
| 1 | Jeff Gordon | 23 | 1 | Tony Stewart | 100 | 18 |
| 2 | Bobby Labonte | 21 | 2 | Bill Elliott | 99.88 | 16 |
| T3 | Jeff Burton | 20 | 3 | Dale Earnhardt | 99.82 | 7 |
| T3 | Kevin Harvick | 20 | 4 | Ernie Irvan | 99.75 | 5 |
| T3 | Kurt Busch | 20 | 5 | Marcos Ambrose | 99.73 | 7 |
| T3 | Mark Martin | 20 | 6 | Ken Schrader | 99.69 | 14 |
| T3 | Matt Kenseth | 20 | 7 | Kevin Harvick | 99.63 | 20 |
| T3 | Ryan Newman | 20 | T8 | Daniel Suarez | 99.59 | 6 |
| 9 | Jimmie Johnson | 19 | T8 | Aric Almirola | 99.59 | 9 |
| T10 | Joe Nemechek | 18 | ||||
| T10 | Kyle Busch | 18 | 10 | Ty Dillon | 99.49 | 6 |
| T10 | Tony Stewart | 18 | ||||
In 18 starts here at Indianapolis Tony Stewart incredibly never finished a lap down, the only driver with 5+ starts here to accomplish that feat. Photo by Rusty Jarrett –Getty Images
| Most Indianapolis Wins All-time |
Best Win% All-time (5+ Indianapolis starts) |
|||||
| Rank | Driver | Wins | Rank | Driver | Win% | Wins |
| 1 | Jeff Gordon | 5 | 1 | Jeff Gordon | 21.74 | 5 |
| 2 | Jimmie Johnson | 4 | 2 | Jimmie Johnson | 21.05 | 4 |
| 3 | Kevin Harvick | 3 | 3 | Bubba Wallace | 20.00 | 1 |
| T4 | Dale Jarrett | 2 | 4 | Dale Jarrett | 15.38 | 2 |
| T4 | Kyle Busch | 2 | 5 | Kevin Harvick | 15.00 | 3 |
| T4 | Tony Stewart | 2 | 6 | Dale Earnhardt | 14.29 | 1 |
| T7 | 11 drivers tied |
1 | 7 | Kyle Larson | 12.50 | 1 |
| T8 | Kyle Busch | 11.11 | 2 | |||
| T8 | Tony Stewart | 11.11 | 2 | |||
| T10 | Brad Keselowski | 7.69 | 1 | |||
| T10 | Paul Menard | 7.69 | 1 | |||
| T10 | Ricky Rudd | 7.69 | 1 | |||
– Jeff Gordon was always fast here at Indianapolis as he holds the top spot in both the Win tables above and is tied for the most Poles here in the table below.
| Rank | Driver | Poles | Rank | Driver | Poles |
| T1 | Kevin Harvick | 3 | T5 | 17 drivers tied |
1 |
| T1 | Jeff Gordon | 3 | |||
| T3 | Ernie Irvan | 2 | |||
| T3 | Kyle Busch | 2 |
| Most Indianapolis Top 3’s All-time |
Best Top 3% All-time (5+ Indianapolis starts) |
|||||
| Rank | Driver | Top 3’s | Rank | Driver | Top3% | Top3’s |
| 1 | Jeff Gordon | 8 | 1 | Bubba Wallace | 40.00 | 2 |
| T2 | Jimmie Johnson | 6 | 2 | Dale Jarrett | 38.46 | 5 |
| T2 | Kevin Harvick | 6 | 3 | Jeff Gordon | 34.78 | 8 |
| T4 | Dale Jarrett | 5 | 4 | Jimmie Johnson | 31.58 | 6 |
| T4 | Matt Kenseth | 5 | 5 | Kevin Harvick | 30.00 | 6 |
| T6 | Denny Hamlin | 4 | T6 | Matt Kenseth | 25.00 | 5 |
| T6 | Kyle Busch | 4 | T6 | Rusty Wallace | 25.00 | 3 |
| T6 | Bobby Labonte | 4 | T6 | Kyle Larson | 25.00 | 2 |
| T9 | Rusty Wallace | 3 | 9 | Denny Hamlin | 23.53 | 4 |
| T9 | Kasey Kahne | 3 | ||||
| T9 | Bill Elliott | 3 | 10 | Kyle Busch | 22.22 | 4 |
| T9 | Tony Stewart | 3 | ||||
– With his win here last year Bubba Wallace now has the best Top 3%, Top 5%, and Top 10% at Indianapolis among drivers with 5+ starts here.
| Most Indianapolis Top 5’s All-time |
Best Top 5% All-time (5+ Indianapolis starts) |
|||||
| Rank | Driver | Top 5’s | Rank | Driver | Top5% | Top5’s |
| 1 | Jeff Gordon | 12 | 1 | Bubba Wallace | 60.00 | 3 |
| 2 | Matt Kenseth | 10 | 2 | Jeff Gordon | 52.17 | 12 |
| 3 | Kevin Harvick | 8 | 3 | Matt Kenseth | 50.00 | 10 |
| 4 | Tony Stewart | 7 | 4 | Dale Earnhardt | 42.86 | 3 |
| T5 | Denny Hamlin | 6 | 5 | Rusty Wallace | 41.67 | 5 |
| T5 | Jimmie Johnson | 6 | 6 | Kevin Harvick | 40.00 | 8 |
| T5 | Mark Martin | 6 | 7 | Tony Stewart | 38.89 | 7 |
| T8 | Rusty Wallace | 5 | 8 | Dale Jarrett | 38.46 | 5 |
| T8 | Dale Jarrett | 5 | 9 | Kyle Larson | 37.50 | 3 |
| T8 | Bill Elliott | 5 | 10 | Denny Hamlin | 35.29 | 6 |
| T8 | Kyle Busch | 5 | ||||
| Most Indianapolis Top 10 All-time |
Best Top 10% All-time (5+ Indianapolis starts) |
|||||
| Rank | Driver | Top 10’s | Rank | Driver | Top10% | Top10’s |
| 1 | Jeff Gordon | 17 | 1 | Bubba Wallace | 80.00 | 4 |
| 2 | Kevin Harvick | 14 | 2 | Rusty Wallace | 75.00 | 9 |
| 3 | Matt Kenseth | 13 | 3 | Jeff Gordon | 73.91 | 17 |
| 4 | Kyle Busch | 12 | 4 | Dale Earnhardt | 71.43 | 5 |
| T5 | Tony Stewart | 11 | 5 | Kevin Harvick | 70.00 | 14 |
| T5 | Mark Martin | 11 | 6 | Kyle Busch | 66.67 | 12 |
| T7 | Rusty Wallace | 9 | 7 | Matt Kenseth | 65.00 | 13 |
| T7 | Bill Elliott | 9 | 8 | Kyle Larson | 62.50 | 5 |
| T7 | Denny Hamlin | 9 | 9 | Tony Stewart | 61.11 | 11 |
| 10 | Joey Logano | 8 | 10 | Ernie Irvan | 60.00 | 3 |
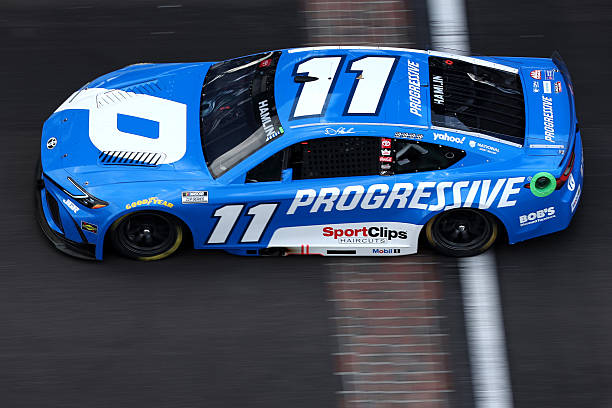
With a Top 10 finish this weekend Denny Hamlin would be just the 7th drivers to record 10+ Top 10 finishes at Indy in a Cup car. Photo by James Gilbert — Getty Images
| Most Indianapolis Stage Wins All-time (since 2017) |
Best Stage Win% All-time (since 2017) |
|||||
| Rank | Driver | Stage W’s |
Rank | Driver | Stage W% | Stage W’s |
| T1 | Kevin Harvick | 2 | T1 | Kevin Harvick | 25.00 | 2 |
| T1 | Kyle Busch | 2 | T1 | Chase Briscoe | 25.00 | 1 |
| T3 | Chase Briscoe | 1 | T3 | Kyle Busch | 16.67 | 2 |
| T3 | Matt Kenseth | 1 | T3 | Matt Kenseth | 16.67 | 1 |
| T3 | Clint Bowyer | 1 | 5 | Clint Bowyer | 12.50 | 1 |
| T3 | Bubba Wallace | 1 | T6 | Bubba Wallace | 10.00 | 1 |
| T3 | William Byron | 1 | T6 | William Byron | 10.00 | 1 |
| T3 | Denny Hamlin | 1 | 8 | Denny Hamlin | 8.33 | 1 |
| T3 | Joey Logano | 1 | T8 | Joey Logano | 8.33 | 1 |
| T3 | Ryan Blaney | 1 | T8 | Ryan Blaney | 8.33 | 1 |
– The only drivers in the Stage Win% table above that could leave this weekend with the lead are Kevin Harvick, Chase Briscoe, Bubba Wallace, and William Byron.
| Most Indianapolis Stage T10’s All-time (since 2017) |
Best Stage T10% All-time (since 2017) |
|||||
| Rank | Driver | Stage T10’s |
Rank | Driver | Stage T10% | Stage T10’s |
| 1 | Denny Hamlin | 8 | 1 | Kevin Harvick | 75.00 | 6 |
| T2 | Kyle Larson | 7 | 2 | Kyle Larson | 70.00 | 7 |
| T2 | Kyle Busch | 7 | T3 | Denny Hamlin | 66.67 | 8 |
| T2 | Ryan Blaney | 7 | T3 | Matt Kenseth | 66.67 | 4 |
| T5 | Kevin Harvick | 6 | 5 | William Byron | 60.00 | 6 |
| T5 | William Byron | 6 | T6 | Kyle Busch | 58.33 | 7 |
| T5 | Joey Logano | 6 | T6 | Ryan Blaney | 58.33 | 7 |
| T8 | Brad Keselowski | 5 | T8 | 9 drivers tied | 50.00 | 1-6 |
| T8 | Chase Elliott | 5 | ||||
| T10 | 5 drivers tied | 4 | ||||
– The five drivers tied for 10th most Stage T10’s here are Matt Kenseth, Clint Bowyer, Jimmie Johnson, Kurt Busch, and Erik Jones.
| Most Indianapolis Starts without Win |
Longest Indianapolis Win Streak All-time |
|||||
| Rank | Driver | Starts | Rank | Driver | Streak | Year |
| T1 | Jeff Burton | 20 | T1 | Jimmie Johnson | 2 | 2008-09 |
| T1 | Kurt Busch | 20 | T1 | Kyle Busch | 2 | 2015-16 |
| T1 | Mark Martin | 20 | T1 | Kevin Harvick | 2 | 2019-2020 |
| T1 | Matt Kenseth | 20 | T4 | 23
drivers tied |
1 | 1994-2025 |
| 5 | Joe Nemechek | 18 | ||||
| T6 | Dale Earnhardt Jr. | 17 | ||||
| T6 | Denny Hamlin | 17 | ||||
| T6 | Martin Truex Jr. | 17 | ||||
| T9 | Clint Bowyer | 15 | ||||
| T9 | Dave Blaney | 15 | ||||
| T9 | Terry Labonte | 15 | ||||
– If Joey Logano doesn’t get the Pole or win the race this weekend then he would join both the “without Win” table above and the “without Pole” table below, as it would be his 15th start here without a single win or Pole.
| Most Indianapolis Starts without Pole |
Longest Indianapolis Pole Streak All-time |
|||||
| Rank | Driver | Starts | Rank | Driver | Streak | Year |
| 1 | Bobby Labonte | 21 | T1 | Jeff Gordon | 2 | 1995-96 |
| T2 | Kurt Busch | 20 | T1 | Ernie Irvan | 2 | 1997-98 |
| T2 | Matt Kenseth | 20 | T1 | Kyle Busch | 2 | 2016-17 |
| 4 | Joe Nemechek | 18 | T4 | 20
drivers tied |
1 | 1994-2025 |
| T5 | Dale Earnhardt Jr. | 17 | ||||
| T5 | Martin Truex Jr. | 17 | ||||
| T7 | Bill Elliott | 16 | ||||
| T7 | Jamie McMurray | 16 | ||||
| T9 | Clint Bowyer | 15 | ||||
| T9 | Dave Blaney | 15 | ||||
| T9 | Terry Labonte | 15 | ||||
| Most Indianapolis Starts without Top 3 |
Longest Indianapolis Top 3 Streak All-time |
|||||
| Rank | Driver | Starts | Rank | Driver | Streak | Year |
| T1 | Jeff Burton | 20 | 1 | Bobby Labonte | 4 | 1997-2000 |
| T1 | Kurt Busch | 20 | T2 | Dale Jarrett | 3 | 1995-97 |
| 3 | Joe Nemechek | 18 | T2 | Kyle Busch | 3 | 2014-16 |
| T4 | Dale Earnhardt Jr. | 17 | T4 | Jeff Gordon | 2 | 1998-99 |
| T4 | Martin Truex Jr. | 17 | T4 | Matt Kenseth | 2 | 2002-03 |
| T6 | Clint Bowyer | 15 | T4 | Jimmie Johnson | 2 | 2008-09 |
| T6 | Dave Blaney | 15 | T4 | Jimmie Johnson | 2 | 2012-13 |
| T8 | Ken Schrader | 14 | T4 | Brad Keselowski | 2 | 2017-18 |
| T8 | Michael Waltrip | 14 | ||||
| T10 | Casey Mears | 13 | T4 | Kevin Harvick | 2 | 2019-20 |
| T10 | David Ragan | 13 | ||||
| T10 | Kyle Petty | 13 | T4 | Kyle Larson | 2 | 2024-25 |
| T10 | Michael McDowell | 13 | ||||
– Bobby Labonte holds the longest Top 3 streak (table above) and Top 5 streak (table below) at Indianapolis with a 4 race streak that spanned the late 90s/early 2000s.
| Most Indianapolis Starts without Top 5 |
Longest Indianapolis Top 5 Streak All-time |
|||||
| Rank | Driver | Starts | Rank | Driver | Streak | Year |
| 1 | Joe Nemechek | 18 | 1 | Bobby Labonte | 4 | 1997-2000 |
| 2 | Dave Blaney | 15 | T2 | Dale Jarrett | 3 | 1995-97 |
| T3 | Ken Schrader | 14 | T2 | Jeff Gordon | 3 | 1997-99 |
| T3 | Michael Waltrip | 14 | T2 | Rusty Wallace | 3 | 2000-02 |
| T5 | Casey Mears | 13 | T2 | Denny Hamlin | 3 | 2014-16 |
| T5 | David Ragan | 13 | T2 | Kyle Busch | 3 | 2014-16 |
| T5 | Kyle Petty | 13 | T2 | Kevin Harvick | 3 | 2018-20 |
| T8 | Michael McDowell | 13 | T8 | 26 drivers tied |
2 | 1994-2025 |
| T8 | A.J. Allmendinger | 12 | ||||
| T8 | Robby Gordon | 12 | ||||
| T8 | Ward Burton | 12 | ||||
| Most Indianapolis Starts without Top 10 |
Longest Indianapolis Top 10 Streak All-time |
|||||
| Rank | Driver | Starts | Rank | Driver | Streak | Year |
| 1 | Joe Nemechek | 18 | T1 | Kyle Busch | 7 | 2010-16 |
| T2 | David Ragan | 13 | T1 | Kevin Harvick | 7 | 2014-20 |
| T2 | Kyle Petty | 13 | 3 | Rusty Wallace | 6 | 1998-2003 |
| T4 | Bobby Hamilton | 10 | T4 | Mark Martin | 5 | 1995-99 |
| T4 | J.J. Yeley | 10 | T4 | Bill Elliott | 5 | 2000-04 |
| T4 | Kenny Wallace | 10 | T4 | Jeff Gordon | 5 | 2001-05 |
| T4 | Landon Cassill | 10 | T4 | Greg Biffle | 5 | 2008-12 |
| T4 | Ricky Stenhouse Jr. | 10 | T4 | Tony Stewart | 5 | 2009-13 |
| 9 | Jeff Green | 9 | T4 | Joey Logano | 5 | 2013-17 |
| T10 | David Gilliland | 8 | T4 | Matt Kenseth | 5 | 2013-17 |
| T10 | Ted Musgrave | 8 | ||||
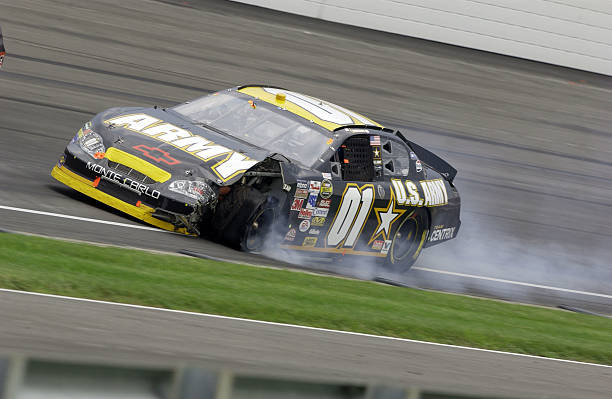
Joe Nemechek never had much success at Indianapolis as he is the only driver that is on every “without” list above. Photo by Harold Hinson — Sporting News via Getty Images via Getty Images
| Most Indianapolis Stages without Stage Win |
Longest Indianapolis Stage Win Streak (since 2017) |
|||||
| Rank | Driver | Stages | Rank | Driver | Streak | Race |
| T1 | Austin Dillon | 12 | 1 | Kyle Busch | 2 | 2017.20 s1&s2 |
| T1 | Brad Keselowski | 12 | T2 | Clint Bowyer | 1 | 2018.26 s1 |
| T1 | Chase Elliott | 12 | T2 | Matt Kenseth | 1 | 2018.26 s2 |
| T1 | Chris Buescher | 12 | T2 | Joey Logano | 1 | 2019.26 s1 |
| T1 | Daniel Suarez | 12 | T2 | Kevin Harvick | 1 | 2019.26 s2 |
| T1 | Erik Jones | 12 | T2 | William Byron | 1 | 2020.16 s1 |
| T1 | Michael McDowell | 12 | T2 | Kevin Harvick | 1 | 2020.16 s2 |
| T1 | Ricky Stenhouse Jr. | 12 | T2 | Denny Hamlin | 1 | 2024.22 s1 |
| T1 | Ty Dillon | 12 | T2 | Bubba Wallace | 1 | 2024.22 s2 |
| T10 | 6 drivers tied | 10 | T2 | Chase Briscoe | 1 | 2025.22 s1 |
| T2 | Ryan Blaney | 1 | 2025.22 s2 | |||
– In 2017 Kyle Busch got the first two Stage Wins in Indianapolis history, and 6 races later he’s still the only driver to get 2 Stage Wins in a row here.
| Most Indianapolis Stages without Stage T10 |
Longest Indianapolis Stage T10 Streak (since 2017) |
|||||
| Rank | Driver | Stages | Rank | Driver | Streak | Race |
| 1 | Ty Dillon | 12 | T1 | Kevin Harvick | 4 | 2019.26 s1- 2020.16 s2 |
| T2 | B.J. McLeod | 10 | T1 | Denny Hamlin | 4 | 2020.16 s1- 2024.22 s2 |
| T2 | Corey LaJoie | 10 | T3 | Kyle Busch | 3 | 2017.20 s1-2018.26 s1 |
| T2 | Ross Chastain | 10 | T3 | Brad Keselowski | 3 | 2017.20 s2- 2018.26 s2 |
| T5 | J.J. Yeley | 8 | T3 | Erik Jones | 3 | 2017.20 s2- 2018.26 s2 |
| T5 | Ryan Preece | 8 | T3 | Jimmie Johnson | 3 | 2018.26 s2- 2019.26 s2 |
| T7 | David Ragan | 6 | T3 | Joey Logano | 3 | 2018.26 s2- 2019.26 s2 |
| T7 | Josh Bilicki | 6 | T3 | Clint Bowyer | 3 | 2019.26 s2- 2020.16 s2 |
| T7 | Landon Cassill | 6 | T3 | Tyler Reddick | 3 | 2024.22 s1- 2025.22 s1 |
| T7 | Timmy Hill | 6 | T3 | Bubba Wallace | 3 | 2024.22 s2- 2025.22 s2 |
– Ty Dillon is the only driver that has run every race at Indianapolis with stages to not get a Stage T10.