
This article is a race finish projection for the 2026 Pocono Cup Race. The finishing order below is determined based on Next Gen Pocono Avg. Finish and Avg. Driver Rating, and 2025/26 Big tracks (2+ miles, non-drafting, non-road course) Avg. Finish and Avg. Driver Rating. In addition, weekend practice speeds (both single lap and multi-lap averages, if there was any) and qualifying results are also taken into account. There is little opinion on the matter as this is based on mostly statistics, so just because a driver with bad stats is in a good car does not mean he will be bumped up based on the car/team he is with.
Last weeks projected winner: Denny Hamlin
Finished: 1st
Last weeks winner: Denny Hamlin
Projected Finish: 1st
Additional notes from last race:
-1 driver finished where they were projected (Denny Hamlin 1st)
-Including the All-Star Race, 4 of the last 5 projected winners went on to win the race, and all 5 finished in the Top 3
-10 of the 37 drivers finished within 5 spots (better or worse) of where they were projected
-18 of the 37 drivers finished 10+ spots (better or worse) than they were projected to finish
-3 of the projected Top 4 drivers finished inside the Top 4
Notes from all point race projections this year (15 races):
-Drivers to finish where they were projected: 27 of 567, 4.76%
-Drivers to finish within 5 spots (better/worse) than they were projected: 229 of 567, 40.39%
-Drivers to finish 10+ spots (better/worse) than they were projected: 206 of 567, 38.87%
-Correct Winner projections: 6 of 15, 40.00%
-Projected Top 10 finishers to finish Top 10: 81 of 150, 54.00%
Notable results this week
Winner: Denny Hamlin
One to Watch: Erik Jones
Disappointment: Ryan Preece
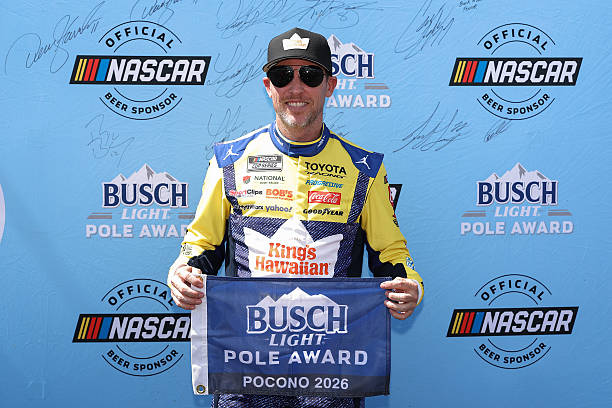
For the 5th week in a row (including the All-Star Race) Denny Hamlin has had good enough stats and speed to be the projected winner. This time it’s for Pocono. Photo by David Jensen — Getty Images
| Proj. Finish | Number | Driver | Finish/Diff. |
| 1. | 11 | Denny Hamlin | – |
| 2. | 5 | Kyle Larson | – |
| 3. | 17 | Chris Buescher | – |
| 4. | 43 | Erik Jones | – |
| 5. | 24 | William Byron | – |
| 6. | 7 | Daniel Suarez | – |
| 7. | 45 | Tyler Reddick | – |
| 8. | 19 | Chase Briscoe | – |
| 9. | 54 | Ty Gibbs | – |
| 10. | 9 | Chase Elliott | – |
| 11. | 12 | Ryan Blaney | – |
| 12. | 77 | Carson Hocevar | – |
| 13. | 20 | Christopher Bell | – |
| 14. | 48 | Alex Bowman | – |
| 15. | 42 | John Hunter Nemechek | – |
| 16. | 22 | Joey Logano | – |
| 17. | 33 | Austin Hill | – |
| 18. | 71 | Michael McDowell | – |
| 19. | 23 | Bubba Wallace | – |
| 20. | 21 | Josh Berry | – |
| 21. | 2 | Austin Cindric | – |
| 22. | 6 | Brad Keselowski | – |
| 23. | 16 | A.J. Allmendinger | – |
| 24. | 38 | Zane Smith | – |
| 25. | 1 | Ross Chastain | – |
| 26. | 41 | Cole Custer | – |
| 27. | 88 | Connor Zilisch | – |
| 28. | 3 | Austin Dillon | – |
| 29. | 47 | Ricky Stenhouse Jr. | – |
| 30. | 60 | Ryan Preece | – |
| 31. | 35 | Riley Herbst | – |
| 32. | 78 | Daniel Dye | – |
| 33. | 62 | Casey Mears | – |
| 34. | 34 | Todd Gilliland | – |
| 35. | 4 | Noah Gragson | – |
| 36. | 97 | Shane Van Gisbergen | – |
| 37. | 10 | Ty Dillon | – |
| 38. | 51 | Cody Ware |
*This will be updated after the race is over so you can compare how the projection did with the actual finishing order.